Interest in the glycemic index (GI) has grown steadily over the years, along with numerous claims about its benefits. However, research on its role in preventing or managing specific health conditions is still developing. Many people may want to adopt a low-GI diet or find lists of low-GI foods, but there are variations to consider. GI values can differ between food categories, across countries, and even within research findings. Additionally, individual responses to foods can vary, and factors like cooking methods can also influence a food’s GI.

What is Glycemic Index, Its Measurement and Physiological responses to High Vs Low GI Foods

Interesting News . Nov 21, 2024

Interest in the glycemic index (GI) has grown steadily over the years, along with numerous claims about its benefits. However, research on its role in preventing or managing specific health conditions is still developing. Many people may want to adopt a low-GI diet or find lists of low-GI foods, but there are variations to consider. GI values can differ between food categories, across countries, and even within research findings. Additionally, individual responses to foods can vary, and factors like cooking methods can also influence a food’s GI.

Glycemic Index?

The glycemic index (GI) is a way to measure how much a food containing carbohydrates raises blood sugar compared to pure glucose, which is used as a standard (GI = 100). Foods are classified as high-GI (70 or higher), moderate-GI (56-69), or low-GI (55 or lower). Eating high-GI foods causes a quick rise in blood sugar followed by a sharp drop, while low-GI foods lead to a slower, more gradual increase and decrease in blood sugar (Refer Table 1).

Operational definition: “The glycemic index (GI) of a food is defined as the glucose response during a 2-hour period following consumption of 50g of carbohydrate from the specific test food, divided by the glucose response after consumption of 50g of carbohydrate from a control food, which generally is either white bread or glucose [1]”.

In the past, carbohydrates were called either “simple” or “complex” based on their structure. Simple carbohydrates, like table sugar or fructose, are made of one or two sugar molecules, while complex carbohydrates, like starch, are made of longer chains of sugar molecules. It was once thought that complex carbohydrates were always better for blood sugar control than simple ones. However, this isn’t always true, as the way different carbohydrates affect blood sugar varies a lot.
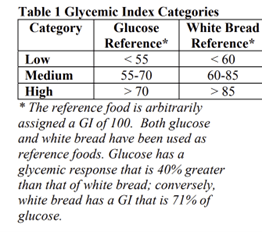
Glycemic Index Category
GI_formula

In the past, carbohydrates were called either “simple” or “complex” based on their structure. Simple carbohydrates, like table sugar or fructose, are made of one or two sugar molecules, while complex carbohydrates, like starch, are made of longer chains of sugar molecules. It was once thought that complex carbohydrates were always better for blood sugar control than simple ones. However, this isn’t always true, as the way different carbohydrates affect blood sugar varies a lot.

To better understand these effects, the concept of GI was introduced. It ranks carbohydrate-containing foods based on how they affect blood sugar after eating. Foods with a high GI (70 or more) have carbohydrates that are quickly digested and absorbed, leading to a rapid rise in blood sugar. In contrast, low-GI foods (55 or less) digest more slowly, resulting in a smaller and slower rise in blood sugar. Foods with a GI in the middle range (56-69) fall between these two. Examples of foods with different GIs are often shown in charts or tables.

Measuring the glycemic index of foods

To measure the glycemic index (GI) of a food, healthy individuals are typically given two different foods to test on separate days: a test food and a reference food, such as pure glucose or white bread, both providing 50 grams of carbohydrates. Blood samples are taken before eating and at regular intervals for several hours afterward to monitor blood glucose levels. These levels are plotted to create an area under the curve showing changes over time. The GI is calculated as the ratio of the incremental area under the curve (iAUC) for the test food to the iAUC for the reference food, multiplied by 100 to represent a percentage:

GI =  (iAUCtest food/iAUCglucose) x 100


For instance, the GI of a boiled white potato averages 82 when compared to glucose and 116 when compared to white bread. This means that the blood sugar response from eating carbohydrates in a boiled potato is 82% of the response from the same amount of glucose and 116% of the response from white bread. On the other hand, cooked brown rice has a GI of 50 relative to glucose and 69 relative to white bread, despite both being traditionally classified as complex carbohydrates. This highlights how carbohydrate classifications alone do not fully predict their impact on blood sugar levels.


Although glucose is the preferred reference food for calculating GI, other foods like white bread can be used for practical purposes, provided their preparation is standardized and calibrated against glucose. Further recommendations have been proposed to enhance the consistency and reliability of GI values for use in research, public health initiatives, and commercial applications.

Physiological responses to high- versus low-glycemic index foods

High-glycemic index (GI) foods are characterized by their ability to cause rapid and significant spikes in blood sugar levels compared to low-GI foods. This sudden rise in blood glucose (hyperglycemia) serves as a strong signal to the pancreas’ β-cells, prompting them to release more insulin (7). The resulting increase in insulin levels (hyperinsulinemia) after consuming high-GI foods may lead to a sharp drop in blood glucose levels (hypoglycemia) within a few hours.

In contrast, consuming low-GI foods leads to a slower and more gradual rise in blood sugar, which is sustained over a longer period. This results in reduced insulin demands on the β-cells of the pancreas, providing a more stable glycemic response and minimizing the risk of dramatic fluctuations in blood glucose levels (8).

At Food Research Lab (FRL), we specialize in providing comprehensive Glycemic Index (GI) testing services that empower food and beverage manufacturers to validate their product’s impact on blood sugar. Our testing follows internationally recognized protocols and is conducted at our ISO-certified clinical research facility, ensuring accuracy, reliability, and global compliance.

Whether you’re developing a new low-GI food, reformulating an existing product, or aiming to make evidence-based claims, our expert team provides tailored solutions for all your GI testing needs. We also offer alternative methods like Glycemic Load (GL) testing for products with unique carbohydrate profiles. With decades of experience, we deliver precise insights to enhance product marketing, labeling, and consumer confidence.

5. South Africa

South Africa is the only country in Africa that has provisions for GI labelling. The Glycaemic Index Foundation of South Africa (GIFSA) was introduced in 1999, making it the world’s first organisation related to the promotion of GI labelling on food and beverage products.

The GIFSA ‘Often Foods’ endorsement logo was soon introduced that distinguishes between “Frequent Foods” (very low GI, low fat), “Often Foods” (low GI, lower fat), “Active Foods” (intermediate GI, medium fat), and “Exercise Foods” (high GI). Like Australia and New Zealand, food products must meet a set of requirements regarding the carbohydrate, fat, sodium, dietary fibre, sugar alcohols and protein content.

6. china

The National Health Commission of China established the first national food standard for measuring the GI of foods in 2019, called “Standard for Determination of Food Glycaemic Index (GI), WS/T 652—2019.” It defines GI and explains GI testing criteria, including the requirement that the finished product have a GI value of 55 to be designated as low GI.1

For product certification, the Chinese Nutrition Society defined the “Standard for GI claims of pre-packaged food T/CNSS 012-2019” in 2020. Food products must match particular nutrient standards and belong to specific food categories for them to be labelled as “Low GI”.

7. Singapore

The Health Promotion Symbol was introduced in 2001 to encourage healthy living. The Healthier Choice symbol was introduced, which was applicable to over 3,500 packaged foods.

The Glycemic Index Research Unit (GIRU) was founded in 2009, and guidelines for functional food testing, including GI testing, were developed at the same time. The low GI Healthier Choice Symbol (HCS) was launched in 2014, initially only for wholegrain cereal food products.

Low GI food products must meet HCS category-specific nutrient standards and have a GI value of 55. Products tested by GIRU bear the Singapore Accreditation Council’s accredited facility’s low GI-tested logo. Enterprise Singapore grants encourage local producers to develop novel low-GI products.

8. Other South East Asian Countries

Food products must be registered in countries such as Vietnam, Thailand, and the Philippines, and food safety authorities assess and approve low GI claims on a case-by-case basis. Low GI claims differ in different parts of South East Asia[1].

Conlcusion

Position your product as a scientifically validated choice for health-conscious consumers. Contact FRL today to learn how our Glycemic Index testing services can help you stand out in the competitive marketplace. Let’s make your product a trusted low-GI option!